

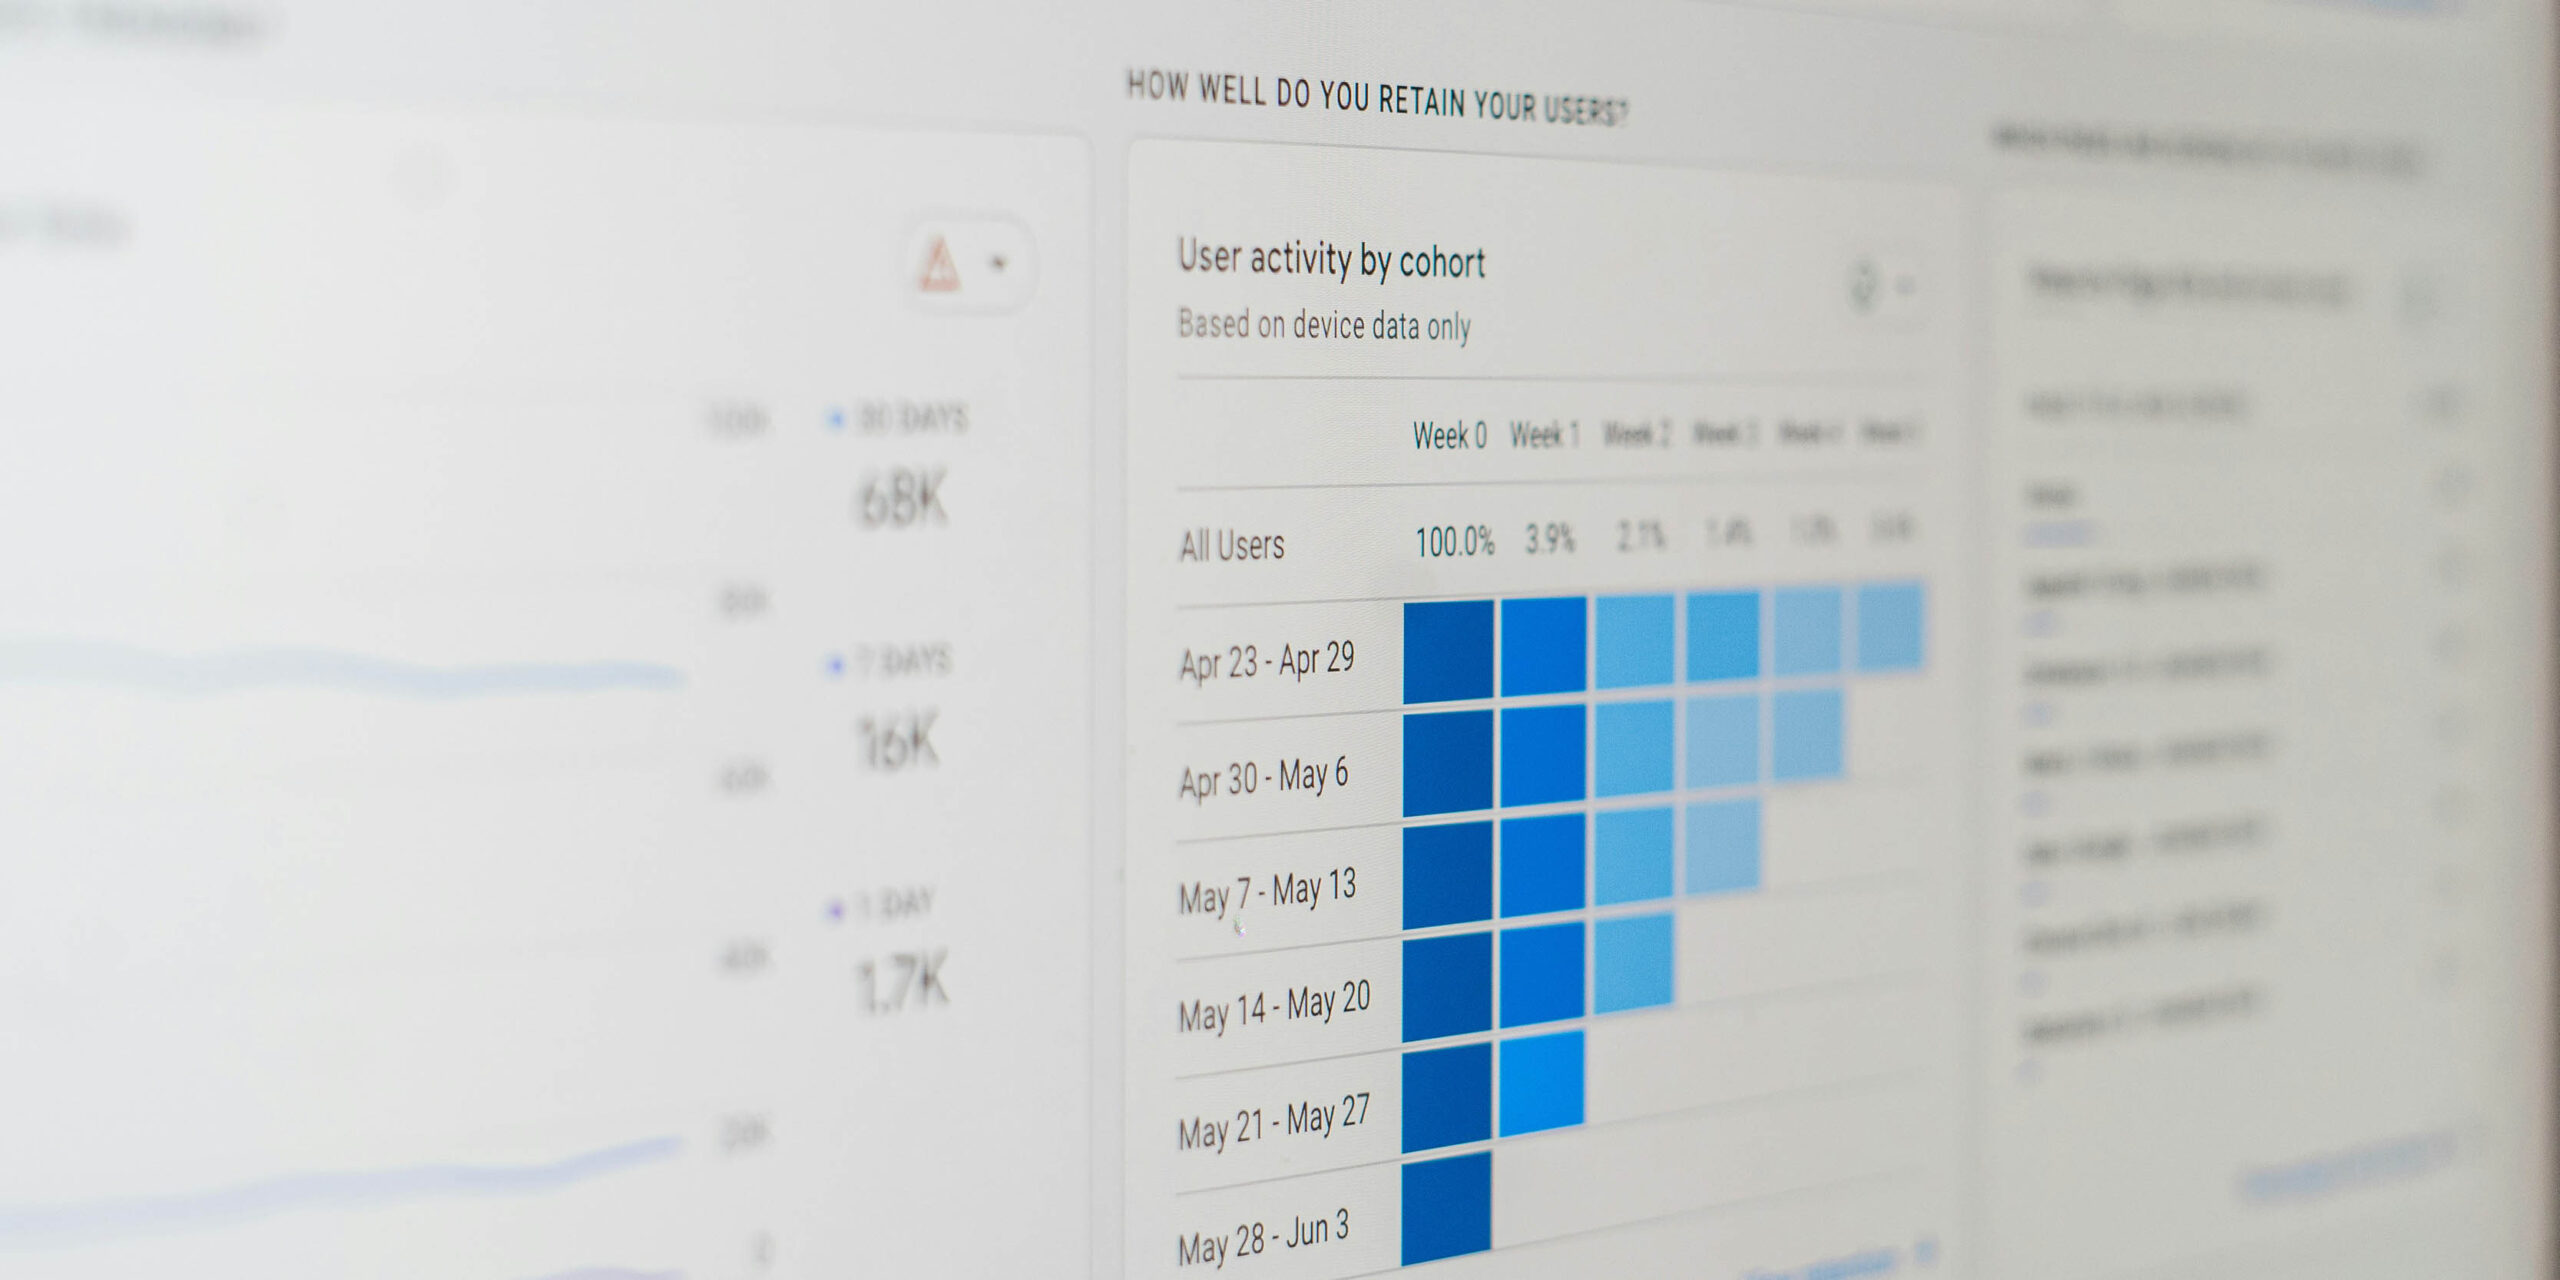
Dashboards—also known as control panels or data visualization interfaces—are sections that allow users to access large amounts of information visually. These graphic interfaces display data, metrics, or KPIs through a wide variety of tables and charts. This enables users to easily consult and analyze the most relevant data, accessing each metric’s details from a single location.
This makes dashboards a complex environment to design, requiring a careful balance between functionality, clarity, and usability. Their development must consider the limited display space, which makes it crucial to plan what will be shown and how. Otherwise, a poorly structured dashboard can become both an ineffective tool and an overwhelming interface, making it harder to understand metrics and make informed decisions.
With that in mind, let’s explore the foundations for designing useful, attractive, and scalable dashboards.
1. Define who will use it and why
There are as many types of dashboards as there are uses and applications. How a dashboard is consulted and what outcomes are expected by an academic, a healthcare professional, or a UX expert, for example, will differ greatly, so it’s essential to tailor the experience to the needs of each user profile.
Considering who will use the dashboard and how often, as well as their context and the decisions they need to make based on the displayed data, are key aspects in designing a good data visualization interface. This tool should anticipate the user’s question or goal and offer a direct, understandable, and fast solution.
2. Hide and prioritize
Although dashboards are meant to provide access to a large volume of data, displaying too much information at once leads to user overload, increases cognitive load, and hampers readability. A strong visual hierarchy can help address this—first showing the most relevant information and general metrics, then progressively revealing more specific data.
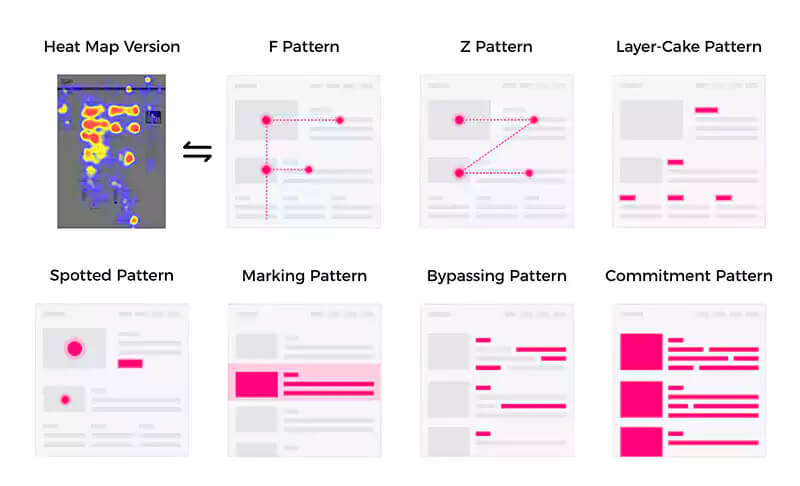
Digital users tend to scan information using F-shaped or Z-shaped reading patterns, so the most important data should be placed in the top, left, and center areas of the screen.
It is also helpful to work with three levels of visibility: level 1 includes the information that is always displayed, level 2 covers components shown on demand, and level 3 contains hidden, highly specific data aimed at advanced users or those requiring more detailed analysis.
Source: Digital Studio
3. Choose the right visualization
There are many data visualization options to consider depending on the dashboard’s purpose and the types of metrics it contains. Design should take into account the user’s level of data literacy and tech familiarity, always prioritizing clarity and efficiency over aesthetics.
Avoid using 3D elements, bevels, shadows, or color gradients, as these can be distracting and reduce readability. Common chart types include:
- Line charts. Ideal for showing data trends over time, allowing users to easily spot peaks and troughs.
- Bar charts. Horizontal or vertical bars make it easy to compare values or categories. They can be stacked to show more complex data.
- Pie charts. Useful for displaying proportions of a whole, though they make comparisons harder.
- Tables. Best for detailed numerical data and cross-referencing values, though they are less visual and intuitive.
- Scatter plots. Show correlations between two variables and can evolve into bubble charts by adding a third variable.
4. Limit interactivity
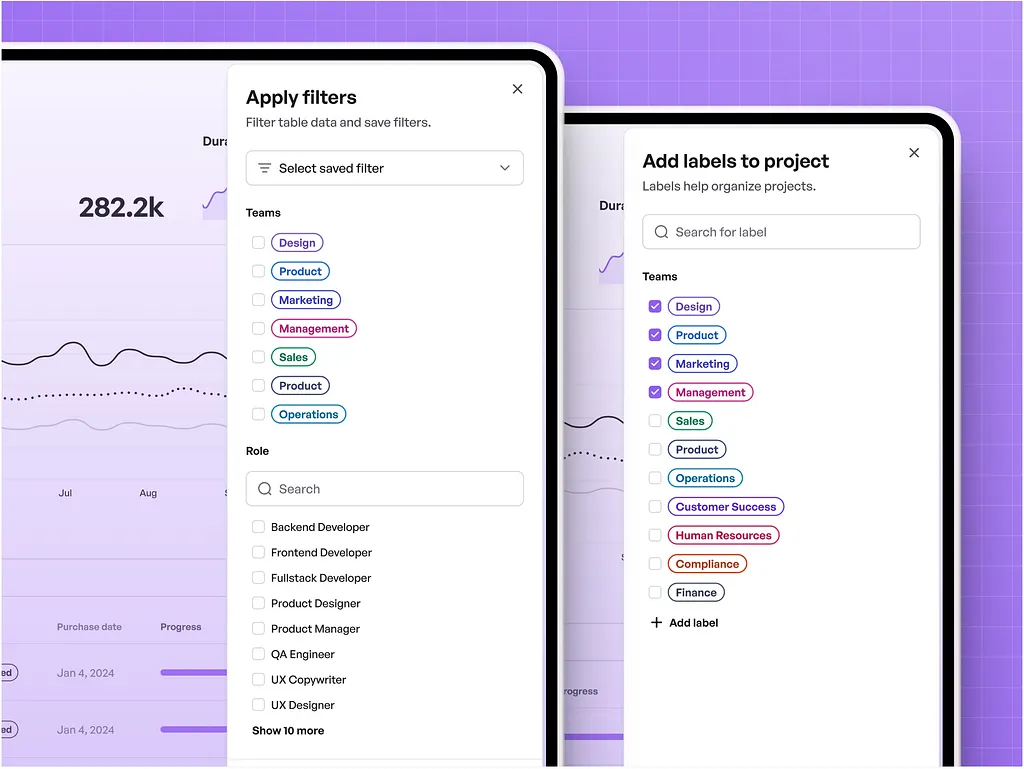
Interactivity is a unique asset of digital environments, expanding the capabilities of dashboards and the amount of data users can explore. Interactive elements include filters and dropdown menus, clickable charts that reveal more details, tooltips, zooming, and switching visualization formats, among others.
However, not every element needs to be clickable or trigger an action. Too many interactive options can overwhelm or frustrate users, encourage misinterpretation of data, and reduce interface performance.
Prioritize interactions that truly add value, define relevant default parameters, and limit visible filters to 3 or 4 at a time. This streamlines the system and enhances the user experience.
Source: Dribbble
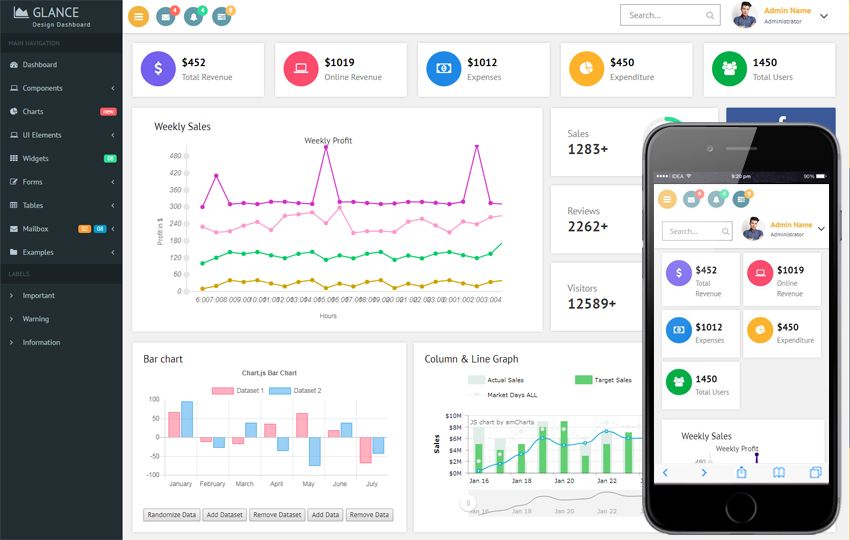
5. Design responsively
Responsive design is a basic requirement for usable, accessible interfaces. However, applying it to data visualization poses unique challenges. Smartphones and tablets demand simplified graphs that focus on the most important KPIs. Keeping only the essentials visible, offering complex data on demand, developing flexible grids, and hiding filters in expandable buttons are some ways to improve usability on small screens.
Dashboard design must also address the needs of touch devices. These benefit from intuitive scrolling, but also require more spacing between components and larger buttons. Including familiar gestures like swiping, double-tapping, or pinching to zoom can be helpful—as long as they’re optional and not the only way to access content.
Source: W3Layouts
6. Suggest improvements
While the primary goal of dashboards is to display metrics, they can also be designed to interpret data and support actionable conclusions. Professionals who use dashboards typically want to understand the current situation to ultimately define solutions or improvements. Supporting informed decision-making transforms these interfaces into valuable business tools.
Dashboards can go a step further by suggesting actions based on current trends and offering insights about the next steps a company should take. Examples include messages recommending that specific campaigns or products be reviewed, suggestions to reallocate the budget across departments, or prompts to revise a low-performing email.
Whether you’re a company specializing in dashboard creation or want to build a quality dashboard within your product, at GammaUX we have a team of professionals dedicated to developing digital products. Get in touch and let’s explore how we can help. Shall we talk?